Six years ago I wanted to make an automatic online backup with history of all script files on the shared work computer. The caveats were:
It must be automatic. I can not relay on anyone performing any action.
It must be user friendly as in any user with basic IT knowledge must be able to find the desired version and restore from it. Changing the files and restoring old versions is quite common behavior.
And the benefits of the situation were, that the machine was running Linux (CentOS) and that the files were all text based scripts, so small file sizes. I made a separate backup system for measurements, but that is a story for another time.
When it comes to “backup” of versions of software, most programmers would jump to Git, as did I for this problem. After my initial attempts of trying to teach everyone Git were unsuccessful, I had to come up with another idea. So the TLDR is that I made a cron script which calls git add . , then git commit and finally git push every 5 minutes.
The longer story has some interesting details. I did not want to touch the original files for “just in case” reasons. So I first made a separate folder to which the script copies all files every 5 minutes and then runs git commands. So, you may be thinking: “This will make a lot of unnecessary commits, as most of the time, there are no changes!” Aha! Git to the rescue. Git automatically doesn’t commit if there is nothing to commit.
The last hurdle is, what to put as commit message? Well, not much can be done automatically, so the commit message is just the datetime stamp. Given the restoring process, it is usually finding the version that worked last Tuesday afternoon, so having the datetime in commit message enables some searching.
What I am most proud of is that it is still working after 6 years and 30 thousand commits. There have been only 3 instances, where I had to manually intervene. They were:
An unknown thing, that was fixed by restarting the computer.
Changing the ownership of the git project, as we needed to stop password sharing my account for obvious security reasons.
When bitbucket forced the use of application keys instead of account passwords.
P.S. I waited to publish this for a couple of weeks, to post it exactly on the 6th anniversary of the beginning of the service.
Because I apparently live in a third world part of my country, I experience a power outage almost every week. Currently it is not that bad, but in the fall, there was a month with at least 4 outages. Most of them last only a couple of seconds, but enough to restart my computer and devices around the house which show the time (for example oven), which is really annoying and probably not good for the longevity of those devices. Some of them take longer, but even though I am signed up for notifications of such events, I am still waiting if I’ll ever receive one.
So, the first solution was to buy an UPS for my computer. One day I would like to have an UPS for the whole house, but that will probably happen when I redo the whole wiring. The other important thing I would like to have battery powered is the natural gas water heater, so I can heat the house during the power outage. It is really annoying, that even though you are heated by natural gas, you still need electricity (supposedly up to 100W peak), but that is also a project for another day.
Back to the UPS for my computer, I settled on Energenie EG-UPS-002, 850 VA “table-top” UPS, mainly because of the price. The other competitors from the same company were either unavailable (EG-UPS-032), have the wrong output (UPS-PC-850AP) or lack USB connection (EG-UPS-B850). The last two are actually almost 10% cheaper with the same rated capacity.
The instructions that come with the selected Energenie EG-UPS-002 or can be found online are really lousy.
USB connection
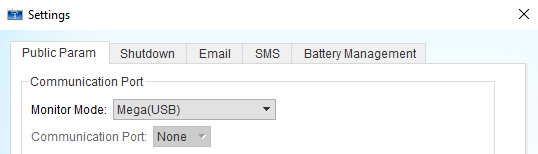
One would think, that for the USB connection, you use the software found on the products page https://energenie.com/item.aspx?id=7609, namely UPSmart2000R, but as the number in the name suggests, this is wildly outdated.
One must, however, download the software from any other Energenie UPS product page (look for driver Energenie UPSmart-II control software (9352 kb)). For the connection type in the settings, select Mega (USB). and it should work.
The software supports most of the things you need, monitoring, turning off the computer if without power for more than X minutes, … But no sleep/hibernation option, although this may be because the UPS is not supposed to work correctly with less than 5% load. The monitoring is also a bit slow for my taste, with 30 seconds being the minimal interval. It does record outages shorter than that, but is does not record the input/output voltage, load, remaining capacity, … more often than every 30s. I think it is limited to detecting outages with resolution of 10 seconds, but time will tell if this is correct.
Conclusion
The UPSmart-II software is good-enough, but I am still looking for (possibly open source or free) alternatives. Look forward to analysis of power outages in the future, when I gather more data.
It has been my longtime wish to make a web tracker, that tracks changes on a given webpage. I tried doing things like that in the past, most successfully with tracking the progress of TeamTrees some years ago. My interest was renewed with the launch of TeamSeas this fall. With this stuff, one must be quick to catch the beginning time period of high activity. I had the tracker up and running within a day, but it was running on my PC with unreliable internet connectivity and electric supply (a story for another time, but I am looking for UPS suggestions). Before making the project public I had to renew my sysadmin knowledge, by migrating all my webpages (and web services) from one virtual server to another, which included upgrading from Ubuntu 14.04 LTS to 20.04 LTS. The details are also a story for another time.
Armed with the newly acquired knowledge of Highcharts web plotting library, this was my default choice for plotting. The original project where I learned it is still awaiting writeup.
TeamSeas
URL: http://quick.blameitonthegoose.com/static/teamseas.html One of the roadblocks I faced was the fact that the “total donated number” on the webpage updates through javascript. So it is not visible in the source html. I was quite worried because I have had bad experiences with this kind of stuff. Luckily I found the source from where the js loads the number https://tscache.com/donation_total.json . It is helpfully in .json format, which saves a lot of bandwidth and processing power. To avoid excessive train on the TeamSeas’ server I decided on 5 min polling interval.
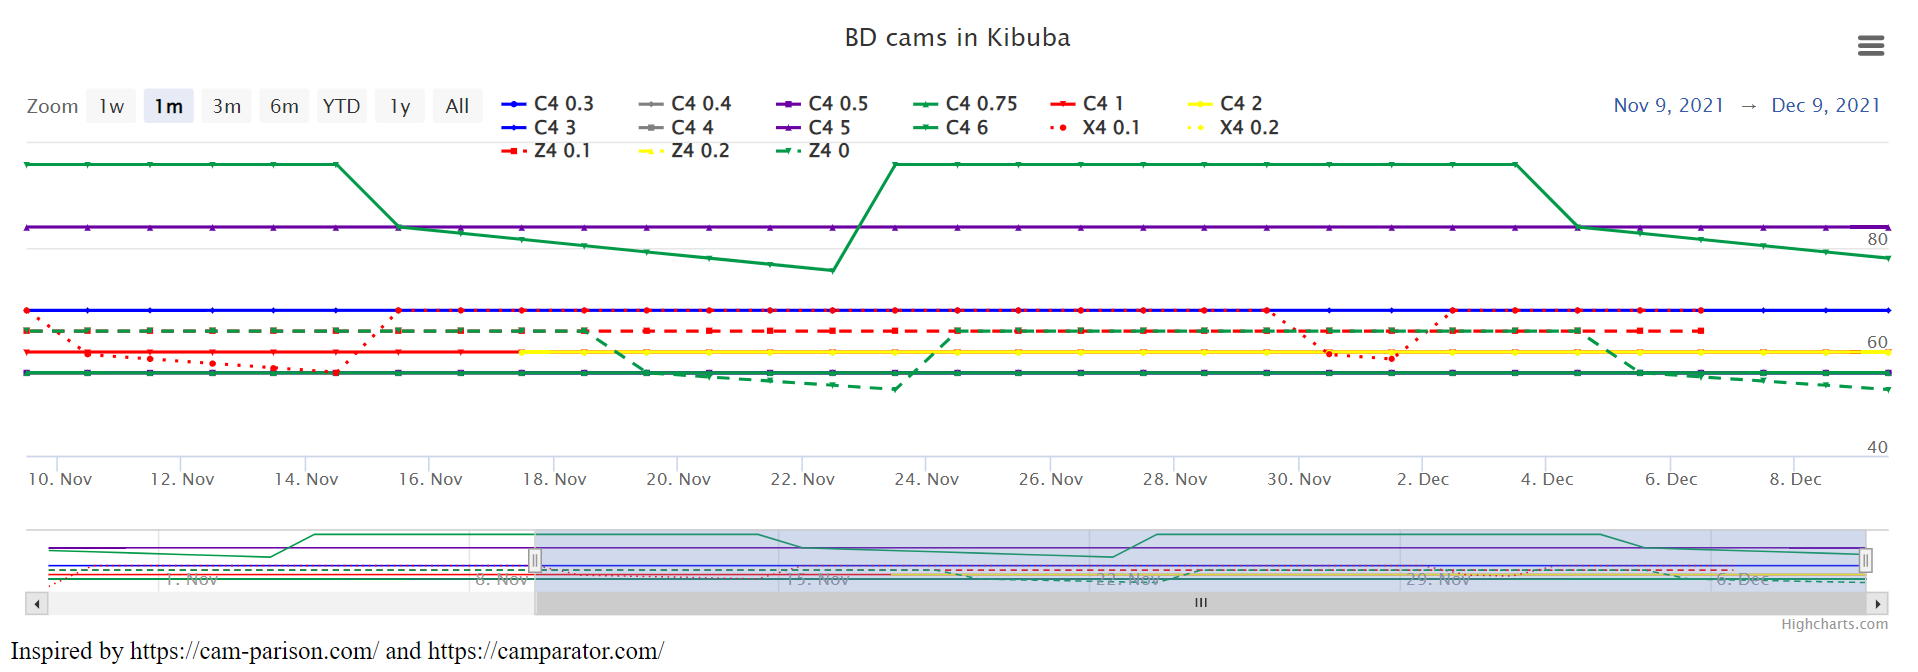
Camparison
URL: http://quick.blameitonthegoose.com/static/camparison.html As an avid climber, I buy a lot of climbing equipment and am always on the lookout for a good deal. Kibuba (Slovenian equipment retailer) has a lot of different sales, so the parsing of the webpage was a bit more challenging. The most interesting one is, where the price of an item falls by 1% every day until it jumps back to the original price. When this happens, you want to wait until the last day, to get the best discount. Having the history of prices enables you to make an educated guess about when the sale will end. Interestingly, for some cams, the maximal sale is constant, while for others it changes from one sale to the next.
Gas prices
URL: http://quick.blameitonthegoose.com/static/dizel.html Currently just for diesel (what I use) for two closest gas stations to my home. This was also one of the main reasons for tackling this project. Since the deregulation of prices of gas in Slovenia, no-one seems to have the history of prices. If someone has a source, please let me know – I spent many hours on google trying to find it. There is a country-wide webpage goriva.si, which sadly does not run without javascript and I was not as lucky with decoding js as in the case of TeamSeas above. So I turned directly to gas station websites. For Petrol, it was quite easy, with a nice webpage for each station, which was static enough to enable parsing using BeautifulSoup4.
Then, there is OMW, the other big provider in Slovenia, with a website even less user (and robot) friendly than goriva.si. First, there is no website for an individual gas station. One must find it on the map and click on it. Next, if that was somehow achievable, the prices are not displayed as text, but as an image! After filing discouraged I took another look at goriva.si and found a django API behind the scenes! Score! https://goriva.si/api/v1/search/?position=Ljubljana&radius=&franchise=&name=&o=. It does return 22 pages of results (25 results per page) for the whole Slovenia. This is not yet in production, but stay tuned to a future post, analyzing the gas prices in Slovenia.
Fun fact (teaser): The last result has location "lat": 1e-15, "lng": -1e-15, which is 5314km from Ljubljana. 🤔
Server overload prevention or detection prevention
While I try to use the services in accordance with the terms of service, one can never be sure if the owners of the website will be satisfied. I manually check for robots.txt and similar files at the beginning, but it is unfeasible to keep track of possible changes. Therefore I try to limit the number of requests as much as possible, by reducing the frequency with which I poll the data. Additionally, where possible, I query directly the data source, not the whole webpage, to reduce the bandwidth used. On the other side of the coin, to try to prevent detection, I randomize the start time of the polling and the delay between the consecutive polls to the same server. There is always at least a minute between requests, so the effect on the servers should be minimal.
Future plans aka TODO
Next plans are
Improvements on the fuel prices as mentioned above.
Mimovrste. Probably the most popular Slovenian online shop. Interestingly, they offer “we will notify you if this item gets below X€”, but it is not as user friendly as one would hope
EpicTV shop. Again for cams and similar expensive climbing equipment.
Webpage change detectors. Services like this exist but are quite expensive with severely limited free tiers. For example, trackly.io with max 3 webpages tracked 1/day and wachete.com with max 5 webpages tracked 1/day.
Email notifications, most importantly for errors on my side. Otherwise, if price_condition send email type of emails
Expanding trackers to accommodate these is not that hard, however, testing and maintaining all the different formats and GUIs is quite time-consuming.
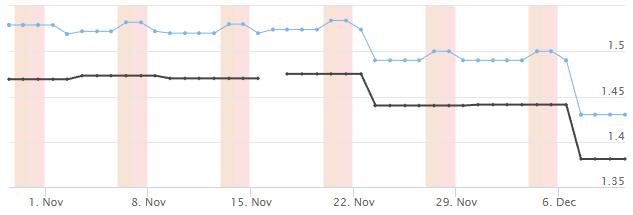
So you have a plot y vs time and you want to denote different days of a week with plotBands. The only problem is, you want to do it dynamically, only from the beginning of your data to the end. Welcome to my world a couple of days ago.
We want something like this. Have some visual background reference for weekends (or even separately for Saturday and Sunday.
This is surely built in to Highcharts. A long google session later: Nope.
There surely is someone who asked this. Yes. Correct. You stumble upon something like https://stackoverflow.com/questions/63629998/highlight-weekend-with-a-plot-band-or-a-zone. Looks perfectly like what you want. After the chart is loaded, it goes over all the data and marks the weekends. Except it doesn’t work if you import data using the HighCharts data module! And the debugging takes another day.
You turn to the old reliable Python, and want to hardcode into the file all the weekends in this century. But surely there must be a way to do it in JS. It can use the fact, that the initial date is known and constant, and that the ending date is today. After too much googling, but you are tired of solutions that don’t work, you arrive at the following 5 lines of code 1
var now = new Date();
var weekends = [];
for (var d = new Date(2021, 9, 1); d <= now; d.setDate(d.getDate() + 1)) {
    if (d.getDay() == 6 || d.getDay() == 0) {// 6 is Saturday, 0 is Sunday
        weekends.push(new Date(d))
    }
}
So much frustration for f****** 5 lines of code.
Well, to fully use this in HighCharts there are a few more lines, but that was the gist. Full code is below. A working example (with different color for Saturday and Sunday) is also on http://quick.blameitonthegoose.com/static/dizel.html, just don’t mind the bad design.
var now = new Date();
var weekends = [];
for (var d = new Date(2021, 9, 1); d <= now; d.setDate(d.getDate() + 1)) {
    if (d.getDay() == 6){
	    weekends.push({ // mark the weekend
                color: "rgba(220, 118, 51, 0.2)", // some color with possible transparency
                from: new Date(d),
                to: new Date(d.setDate(d.getDate() + 2)) // for weekend lasting from Sat 0:00 to Mon 0:00. Change if needed
                })

    }
}


// and add this to the Highcharts chart entity
    xAxis: {
        plotBands: weekends,
    },
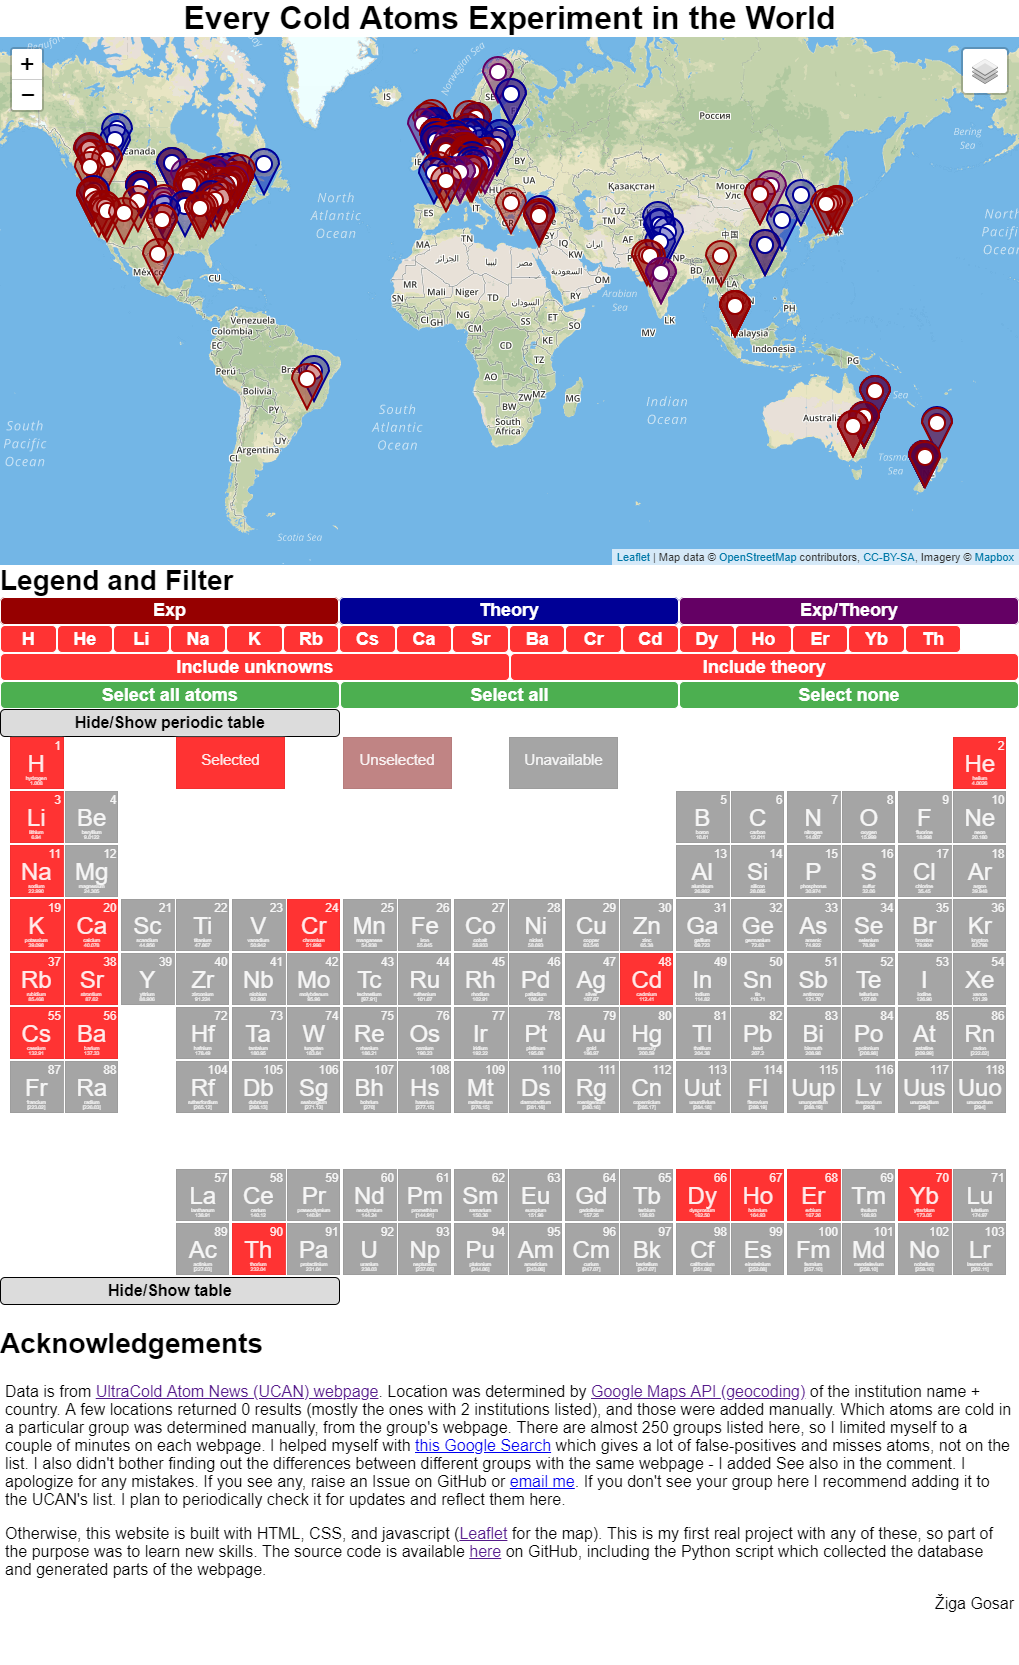
I made a new webpage everycoldatom.com! It displays all cold atoms groups in the world.
EveryColdAtom.com Screenshot
Background
I worked in a cold atoms laboratory at Jožef Stefan Institute in 2016, where they cool Caesium atoms to nano Kelvins above absolute zero. I was wondering, how many other labs have cold Caesium atoms, but couldn’t find a good source. There exists Ultracold Atom News (UCAN) webpage, which helpfully lists all cold atoms groups – sadly without the information about which atoms they use.
How it’s made?
Database
First I parsed the whole database from the UCAN webpage.
Then I used the info (institution name and country) to obtain the geolocation using geocoding from Google Maps API. It was successful for all but around 20 groups. I obtained the location of those manually – the most common problem was, that a group had two institutions listed and that confused Google Maps API.
Lastly, the information about which atoms are used needed to be obtained. I did this assisted-manually. I tried to get the info by manually looking at the group’s website, and by google searching for Hydrogen OR Helium OR Lithium OR Sodium OR Potassium OR Rubidium OR Caesium OR Calcium OR Strontium OR Chromium OR Dysprosium OR Erbium OR Ytterbium OR thorium OR barium site:website. The search query started with a list of atoms I was aware of that are cooled and expanded it when I found out about another atom. As there are around 250 groups on the list, I limited myself to a couple of minutes on each webpage. There were a few problems I encountered on the way. Firstly, a lot of webpages didn’t work. I tried my best to find the new webpage and included it in the comment. Similar problem was, that the webpage linked to the webpage of the whole department/institution, not just the group. Similarly, some groups at the same institution had a common webpage – I attributed all of them with all the atoms I found on the webpage and added a “See also” in the comment. Finally, for some groups, I was unable to find out this piece of information, which I find baffling.
The map
I recently found out about Leaflet – a javascript library for displaying maps. And part of the motivation for this project was, to learn how to use Leaflet. The usage is pretty straightforward. I had a big json database, generated by Python, which included all data about markers. I additionally used two plugins – Overlapping Marker Spiderfier for the spread out/spiderify effect when you click on a group of markers close together; and Leaflet-SVGIcon for marker customization.
There was a bit of playing around, to manage to update the map according to filters underneath.
The periodic table
The periodic table is based on this example. Except for fixing spelling mistakes in atom names, changing the design, and adding onClick events, I didn’t change much.
The table
The table was generated by a Python script.
Sorting was copied from TablesGenerator.com and I have no idea, how it works.
Updates
I am planning on periodically checking the UCAN webpage and reflecting their updates on my page (automatic diff detection, but manual updates). In the few weeks between me completing the webpage and writing this blogpost, they updated their webpage, so I had to rewrite the parser.
Last Christmas (2016) I wanted to make custom lights for a Christmas Tree but ran out of time. This Christmas (2017) I succeeded.
The idea
The idea was to use an Arduino to power WS2812 LED strips. WS2812 are RGB LEDs with an included microprocessor, that allows you to control all of them with a single data pin. This greatly simplifies the wiring process. At the time I had four 1m strips with 30 LEDs each. They were bought at different shops (mostly on AliExpress). Sadly this was noticeable – the colors and brightnesses were slightly different. Also one led was broken, but luckily only the LED, not the microprocessor, so the successive LEDs worked correctly.
Each LED uses around 20mA of current per color when fully lit. That means 120*3*20mA = 7.2A for all of them on full brightness white. The best power source I had was 3A phone charger, which limited the max brightness. I could have full brightness on one color (red, green or blue), but not white. Luckily the full brightness was too bright for a Christmas tree in the dark, so that wasn’t a problem.
Software
At first, it was meant to be controlled by many buttons. Because I only had 4 correct resistors I only used 4 – one for mode, color, brightness, and speed. Each button press goes to the next setting until it loops back around. Later I also added serial control, for easier debugging and more accurate control. I don’t like interrupts, so I wrote it without them. There are still a few bugs (mostly with serial control), but I will fix them next year.
There are 7 modes
All On – All LEDs are statically turned on.
Fill Up – The LEDs turn on one by one, and then turn off one by one along the strip.
Fade Out/In – All the LEDs brightness dims out and back on up to the full brightness as set by brightness setting.
Rainbow – The LEDs have different colors, like on a color wheel. The order and colors are not actually as on a rainbow. The colors move around the strips in a circle. The color setting obviously doesn’t do anything in this mode.
Every Second – Every second LED is lit, and then it switches to the other every second lit.
Every Fifth – Every fifth LED is lit, and the lit LED move by one.
Every Tenth – The same, but every tenth LED is lit.
5 colors (red, green, blue, yellow, white)
25 brightness settings (in steps of 10 from 5 to 255)
and 10 speed settings. The same speed setting has a different meaning in different modes. But the speed number always means that the delay is that multiple of some base delay.
Changing the color/brightness/speed preserves the state in the current mode (it doesn’t restart).
Code
I haven’t found a good way to embed GitHub code in this blogpost, so here it is. Warning: the code is not that pretty.
Future development
Next year, it will be controllable via Wi-Fi (using ESP8266 or something similar). And even more LEDs – just after Christmas I finally received another 2 meters that I ordered back in November. Now I also received some 60LED/m and 144LED/m strips. I just need to solve the power supply problem. I also have ideas for new modes, most importantly a mode similar to “Every Second”, but that the LEDs slowly fade out and at the same time the next LED fades in.
I started a science and tech blog (this thing that you are reading now). The main goal of this platform is to give me more motivation to finish (side) projects (like this website) and to write about them. Planned projects include (but aren’t limited to) things to do with Arduino, Raspberry Pi, programming, video making… I don’t have a schedule or a desired frequency of posts (yet). It will probably start fast, as I finished a few projects before finishing this webpage, but then it will slow down.
A quick About me
From: Ljubljana, Slovenia.
Occupation: physics student at the University of Ljubljana.1
Free time: Work.2
Other free time: Alpinism.


Recent Comments