
It has been my longtime wish to make a web tracker, that tracks changes on a given webpage. I tried doing things like that in the past, most successfully with tracking the progress of TeamTrees some years ago. My interest was renewed with the launch of TeamSeas this fall. With this stuff, one must be quick to catch the beginning time period of high activity. I had the tracker up and running within a day, but it was running on my PC with unreliable internet connectivity and electric supply (a story for another time, but I am looking for UPS suggestions). Before making the project public I had to renew my sysadmin knowledge, by migrating all my webpages (and web services) from one virtual server to another, which included upgrading from Ubuntu 14.04 LTS to 20.04 LTS. The details are also a story for another time.
Armed with the newly acquired knowledge of Highcharts web plotting library, this was my default choice for plotting. The original project where I learned it is still awaiting writeup.
TeamSeas
URL: http://quick.blameitonthegoose.com/static/teamseas.html
One of the roadblocks I faced was the fact that the “total donated number” on the webpage updates through javascript. So it is not visible in the source html. I was quite worried because I have had bad experiences with this kind of stuff. Luckily I found the source from where the js loads the number https://tscache.com/donation_total.json . It is helpfully in .json format, which saves a lot of bandwidth and processing power. To avoid excessive train on the TeamSeas’ server I decided on 5 min polling interval.
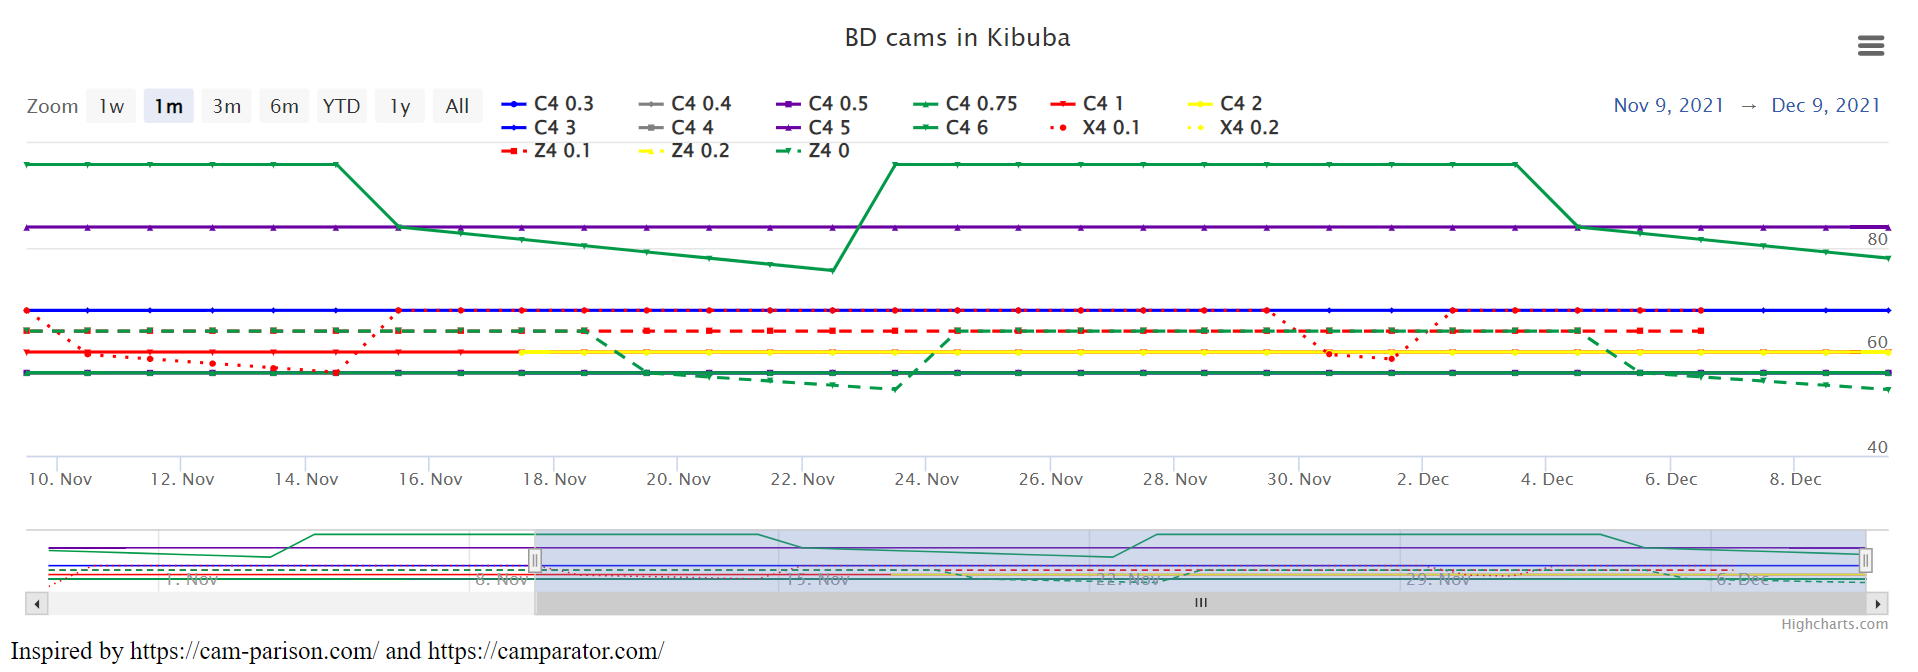
Camparison
URL: http://quick.blameitonthegoose.com/static/camparison.html
As an avid climber, I buy a lot of climbing equipment and am always on the lookout for a good deal. Kibuba (Slovenian equipment retailer) has a lot of different sales, so the parsing of the webpage was a bit more challenging. The most interesting one is, where the price of an item falls by 1% every day until it jumps back to the original price. When this happens, you want to wait until the last day, to get the best discount. Having the history of prices enables you to make an educated guess about when the sale will end. Interestingly, for some cams, the maximal sale is constant, while for others it changes from one sale to the next.
Gas prices
URL: http://quick.blameitonthegoose.com/static/dizel.html Currently just for diesel (what I use) for two closest gas stations to my home.
This was also one of the main reasons for tackling this project. Since the deregulation of prices of gas in Slovenia, no-one seems to have the history of prices. If someone has a source, please let me know – I spent many hours on google trying to find it. There is a country-wide webpage goriva.si, which sadly does not run without javascript and I was not as lucky with decoding js as in the case of TeamSeas above. So I turned directly to gas station websites. For Petrol, it was quite easy, with a nice webpage for each station, which was static enough to enable parsing using BeautifulSoup4.
Then, there is OMW, the other big provider in Slovenia, with a website even less user (and robot) friendly than goriva.si. First, there is no website for an individual gas station. One must find it on the map and click on it. Next, if that was somehow achievable, the prices are not displayed as text, but as an image! After filing discouraged I took another look at goriva.si and found a django API behind the scenes! Score! https://goriva.si/api/v1/search/?position=Ljubljana&radius=&franchise=&name=&o=. It does return 22 pages of results (25 results per page) for the whole Slovenia. This is not yet in production, but stay tuned to a future post, analyzing the gas prices in Slovenia.
Fun fact (teaser): The last result has location "lat": 1e-15, "lng": -1e-15, which is 5314km from Ljubljana. 🤔
Server overload prevention or detection prevention
While I try to use the services in accordance with the terms of service, one can never be sure if the owners of the website will be satisfied. I manually check for robots.txt and similar files at the beginning, but it is unfeasible to keep track of possible changes. Therefore I try to limit the number of requests as much as possible, by reducing the frequency with which I poll the data. Additionally, where possible, I query directly the data source, not the whole webpage, to reduce the bandwidth used. On the other side of the coin, to try to prevent detection, I randomize the start time of the polling and the delay between the consecutive polls to the same server. There is always at least a minute between requests, so the effect on the servers should be minimal.
Future plans aka TODO
Next plans are
- Improvements on the fuel prices as mentioned above.
- Mimovrste. Probably the most popular Slovenian online shop. Interestingly, they offer “we will notify you if this item gets below X€”, but it is not as user friendly as one would hope
- EpicTV shop. Again for cams and similar expensive climbing equipment.
- Webpage change detectors. Services like this exist but are quite expensive with severely limited free tiers. For example, trackly.io with max 3 webpages tracked 1/day and wachete.com with max 5 webpages tracked 1/day.
- Email notifications, most importantly for errors on my side. Otherwise,
if price_condition send emailtype of emails
Expanding trackers to accommodate these is not that hard, however, testing and maintaining all the different formats and GUIs is quite time-consuming.
Recent Comments