
I made a new webpage everycoldatom.com! It displays all cold atoms groups in the world.
EveryColdAtom.com Screenshot
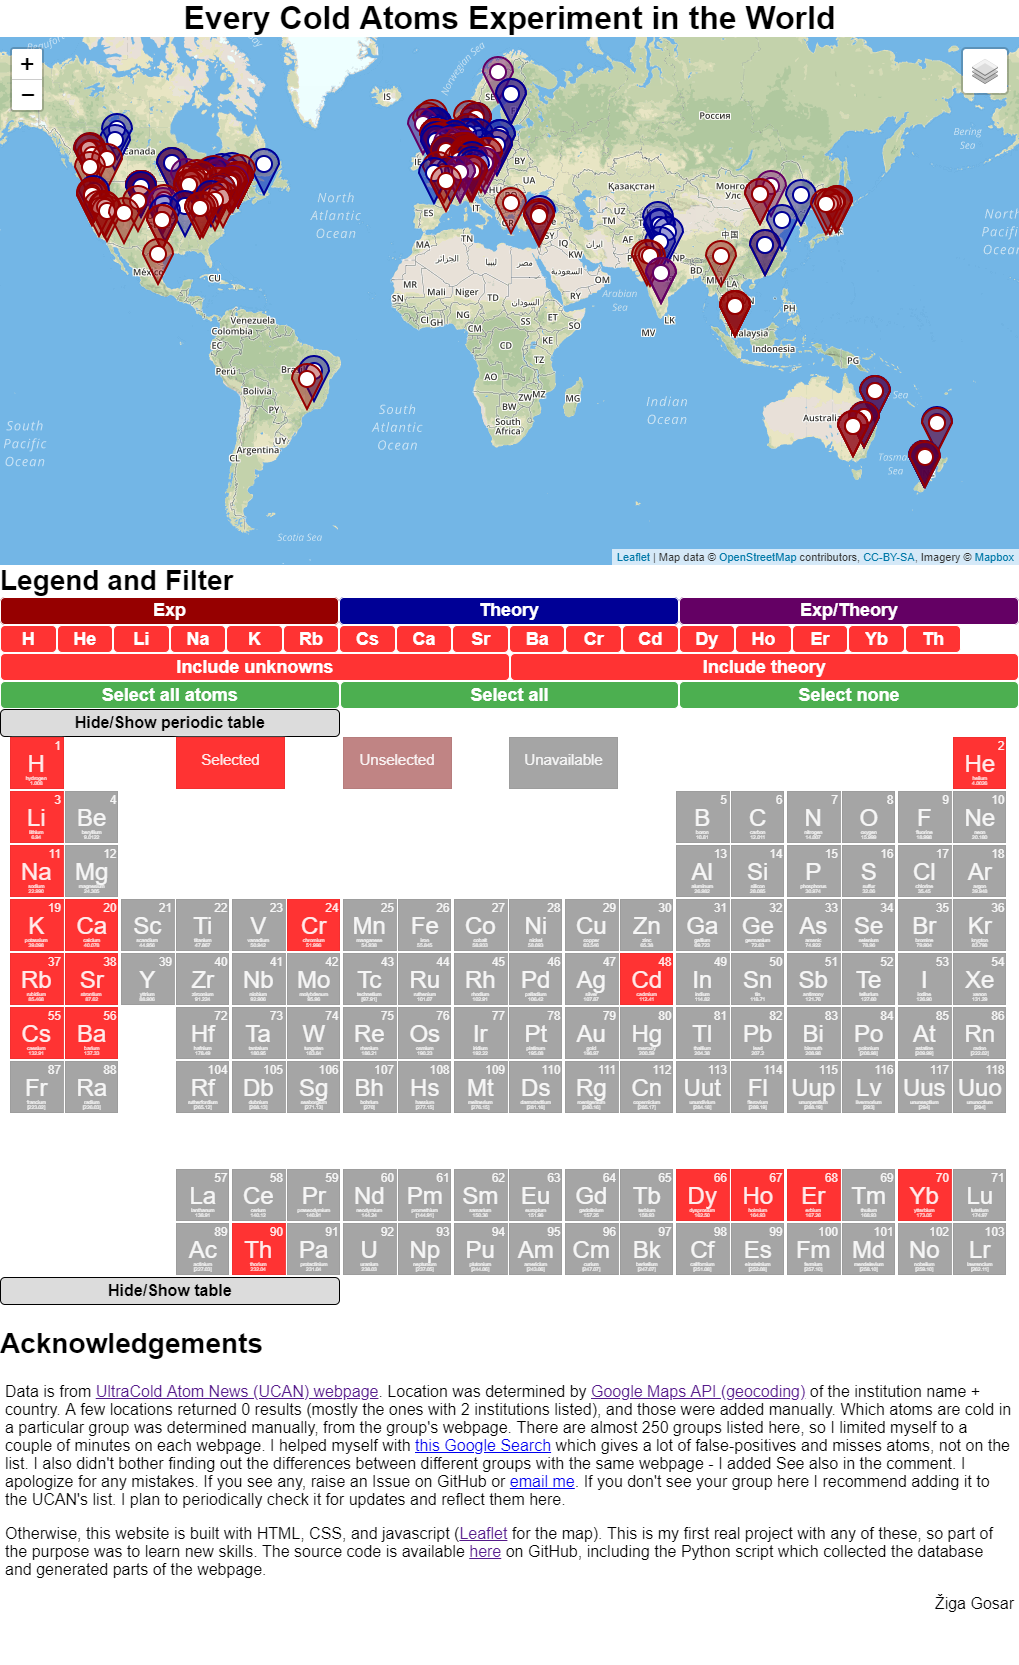
Background
I worked in a cold atoms laboratory at Jožef Stefan Institute in 2016, where they cool Caesium atoms to nano Kelvins above absolute zero. I was wondering, how many other labs have cold Caesium atoms, but couldn’t find a good source. There exists Ultracold Atom News (UCAN) webpage, which helpfully lists all cold atoms groups – sadly without the information about which atoms they use.
How it’s made?
Database
First I parsed the whole database from the UCAN webpage.
Then I used the info (institution name and country) to obtain the geolocation using geocoding from Google Maps API. It was successful for all but around 20 groups. I obtained the location of those manually – the most common problem was, that a group had two institutions listed and that confused Google Maps API.
Lastly, the information about which atoms are used needed to be obtained. I did this assisted-manually. I tried to get the info by manually looking at the group’s website, and by google searching for Hydrogen OR Helium OR Lithium OR Sodium OR Potassium OR Rubidium OR Caesium OR Calcium OR Strontium OR Chromium OR Dysprosium OR Erbium OR Ytterbium OR thorium OR barium site:website. The search query started with a list of atoms I was aware of that are cooled and expanded it when I found out about another atom. As there are around 250 groups on the list, I limited myself to a couple of minutes on each webpage. There were a few problems I encountered on the way. Firstly, a lot of webpages didn’t work. I tried my best to find the new webpage and included it in the comment. Similar problem was, that the webpage linked to the webpage of the whole department/institution, not just the group. Similarly, some groups at the same institution had a common webpage – I attributed all of them with all the atoms I found on the webpage and added a “See also” in the comment. Finally, for some groups, I was unable to find out this piece of information, which I find baffling.
The map
I recently found out about Leaflet – a javascript library for displaying maps. And part of the motivation for this project was, to learn how to use Leaflet. The usage is pretty straightforward. I had a big json database, generated by Python, which included all data about markers. I additionally used two plugins – Overlapping Marker Spiderfier for the spread out/spiderify effect when you click on a group of markers close together; and Leaflet-SVGIcon for marker customization.
There was a bit of playing around, to manage to update the map according to filters underneath.
The periodic table
The periodic table is based on this example. Except for fixing spelling mistakes in atom names, changing the design, and adding onClick events, I didn’t change much.
The table
The table was generated by a Python script.
Sorting was copied from TablesGenerator.com and I have no idea, how it works.
Updates
I am planning on periodically checking the UCAN webpage and reflecting their updates on my page (automatic diff detection, but manual updates). In the few weeks between me completing the webpage and writing this blogpost, they updated their webpage, so I had to rewrite the parser.
Recent Comments